Nikhil Investing Logo

Economic indicator

How to use the Yield Curve to make better investment decisions

By |2022-12-13T23:58:46+00:00December 8th, 2022|Economic indicator|

How to use the Yield Curve to make better investment decisions What is a Yield Curve? A yield curve is a graph which plots the yields of bonds with different maturities. It’s used to compare the yields of different types of bonds, usually at a specific point in time. Yield curves are often

What is the Buffett Indicator?

By |2022-12-13T23:58:28+00:00November 21st, 2022|Economic indicator|

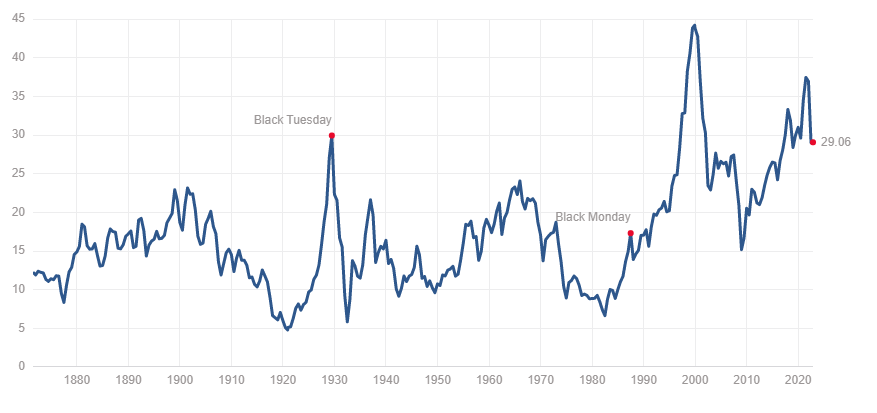
What is the Buffett Indicator? The Buffett Indicator is a market valuation metric created by Warren Buffett. The indicator is the ratio of the market capitalization of all publicly traded companies to the gross domestic product of the United States. Market Cap to GDP is a high level valuation indicator for stocks. Many investors

Go to Top