How to use the Yield Curve to make better investment decisions
What is a Yield Curve?
A yield curve is a graph which plots the yields of bonds with different maturities. It’s used to compare the yields of different types of bonds, usually at a specific point in time. Yield curves are often used to measure the health of an economy, as changes in the shape of the curve can indicate changes in the economic outlook.
Types of Yield Curves
There are two main types of yield curves: normal and inverted. A normal yield curve is one where longer–term bonds have higher yields than shorter–term bonds. This is usually seen in a healthy economy, where investors are willing to accept a lower rate of return for holding their money for a longer period of time. An inverted yield curve is the opposite, where short–term bonds have higher yields than long–term ones. This is often seen during periods of economic uncertainty, as investors demand higher returns to compensate for the risk of holding their money for a longer period of time.
How to Use Yield Curves in Investing
Yield curves can be used by investors to make informed decisions about where to invest their money. For example, an investor looking for a safe investment with a steady return may choose to invest in bonds with maturities that are close to the average yield on the yield curve. Conversely, an investor looking for a higher return may choose to invest in bonds with maturities that are further out on the curve.
Yield curves can also be used to measure the sentiment of the market. For example, an inverted yield curve can indicate that investors are expecting a recession, while a normal yield curve can indicate that investors are expecting economic growth.
In summary, yield curves are an important tool for investors to use when making investment decisions. By analyzing yield curves, investors can gain insight into the current economic outlook and make more informed decisions about where to invest their money.
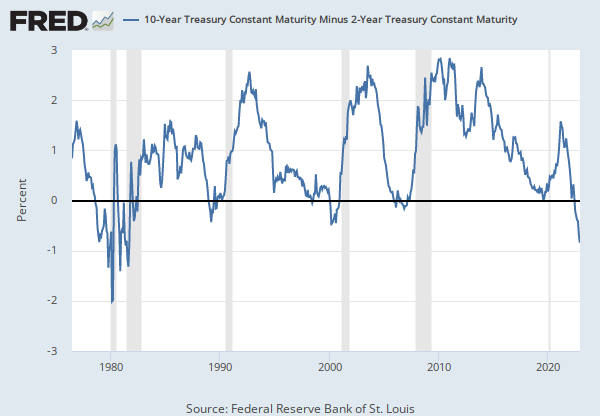
Why Does the Yield–Curve Slope Predict Recessions?
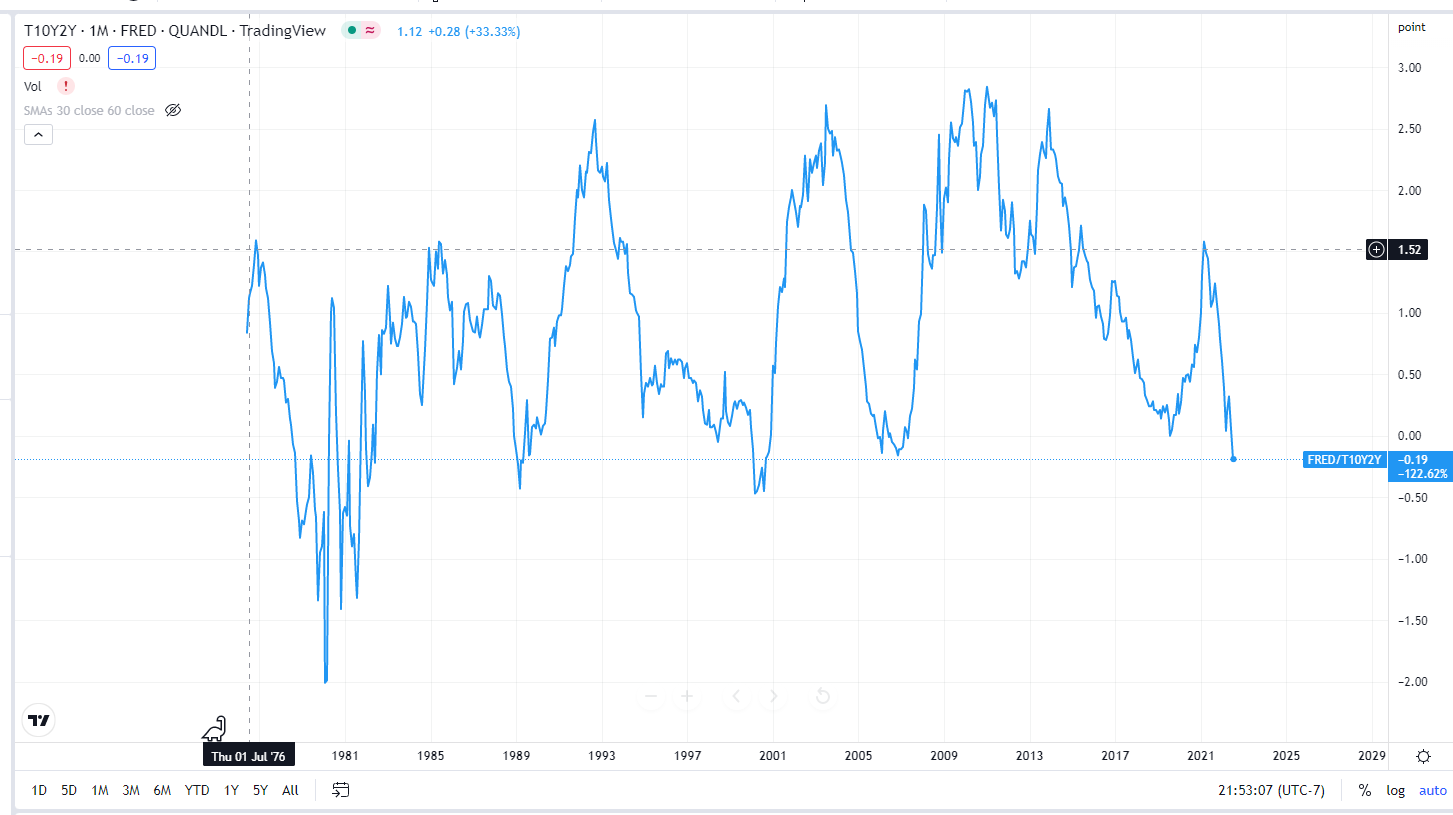
The yield curve is an important tool used to measure the health of the economy. It shows the relationship between short–term and long–term interest rates. A typical yield curve is upward–sloping, meaning that long–term interest rates are typically higher than short–term interest rates. However, when the yield curve inverts, meaning that short–term interest rates are higher than long–term interest rates, it can be a sign that a recession is coming.
The reason why the yield curve slope is a good predictor of recessions is because it reflects the expectations of investors. When short-term interest rates are higher than long-term interest rates, it means that investors expect the economy to weaken in the future. This causes them to shift their investments away from long-term securities, such as bonds, and into short-term securities, such as money market funds. This shift in investment causes the yield curve to invert, which is an early warning sign of an impending recession.
The yield curve has been an accurate predictor of recessions for the past several decades. In the past, yield curve inversions have preceded all but one of the last seven recessions. This pattern has been so reliable that the Federal Reserve now uses the yield curve as one of the indicators it monitors to help predict when a recession may be on the horizon. The yield curve is an important and reliable tool for predicting recessions. Investors should take note of the shape of the yield curve and be aware of the potential implications of an inverted yield curve. By doing so, they can better prepare themselves and their investments for a potential recession.
