What is the Buffett Indicator?
The Buffett Indicator is a market valuation metric created by Warren Buffett. The indicator is the ratio of the market capitalization of all publicly traded companies to the gross domestic product of the United States.
Market Cap to GDP is a high level valuation indicator for stocks. Many investors frequently check the buffet indicator. In interview with Fortune Magazine Mr. Buffet said that “it is probably the best single measure of where valuations stand at any given moment.”
What does the Buffett Indicator tell you?
The Buffett Indicator can be used to determine whether the market is overvalued or undervalued. A high ratio indicates that the market is overvalued, while a low ratio indicates that the market is undervalued.
How accurate is the Buffett Indicator?
The Buffett Indicator has been shown to be a reliable predictor of future market performance. In general, a market cap to GDP ratio below 80% indicates that the market is undervalued, while a ratio above 120% indicates that the market is overvalued.
What are the implications of the Buffett Indicator?
The Buffett Indicator can be used to help make investment decisions. When the indicator is below 80%, it may be a good time to buy stocks, while a ratio above 120% may indicate that it is time to sell.

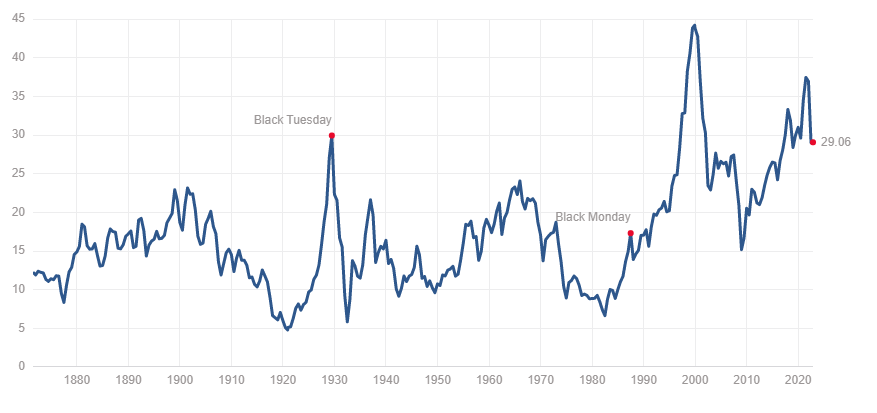
The ratio in the chart above is calculated by dividing the ‘Wilshire 5000 Total Market Index’ by the US GDP. The Wilshire 5000 is widely accepted as the definitive benchmark for the US equity market and is intended to measure the total market capitalization of all US equity securities with readily available price data.
Data Sources
- Federal Reserve Bank of St. Louis: Wilshire 5000 Full Cap Price Index
- Federal Reserve Bank of St. Louis: US Gross Domestic Product
Buffett Indicator today?
The Buffett Indicator currently (20 Nov 2022) stands at around 151%. This means that the market is currently overvalued.
Various approach to identify under valued stock
- There is no definitive answer, but one approach is to look for stocks with a low Shiller P/E ratio. This indicates that the stock may be undervalued relative to its earnings.
- Another approach is to look for stocks that have a high dividend yield. This indicates that the stock may be undervalued relative to its dividend payments.
- Finally, you can also look for stocks that have a low price-to-earnings ratio. This indicates that the stock may be undervalued relative to its earnings.
- Ultimately, it is up to the individual investor to decide what criteria to use when picking stocks. However, using a combination of these three ratios is a good starting point.